
Search traffic in 2026: what our client charts show
How search traffic moved for the blogs we look after this year, where the clicks came from, and the three charts we now send every client each month.
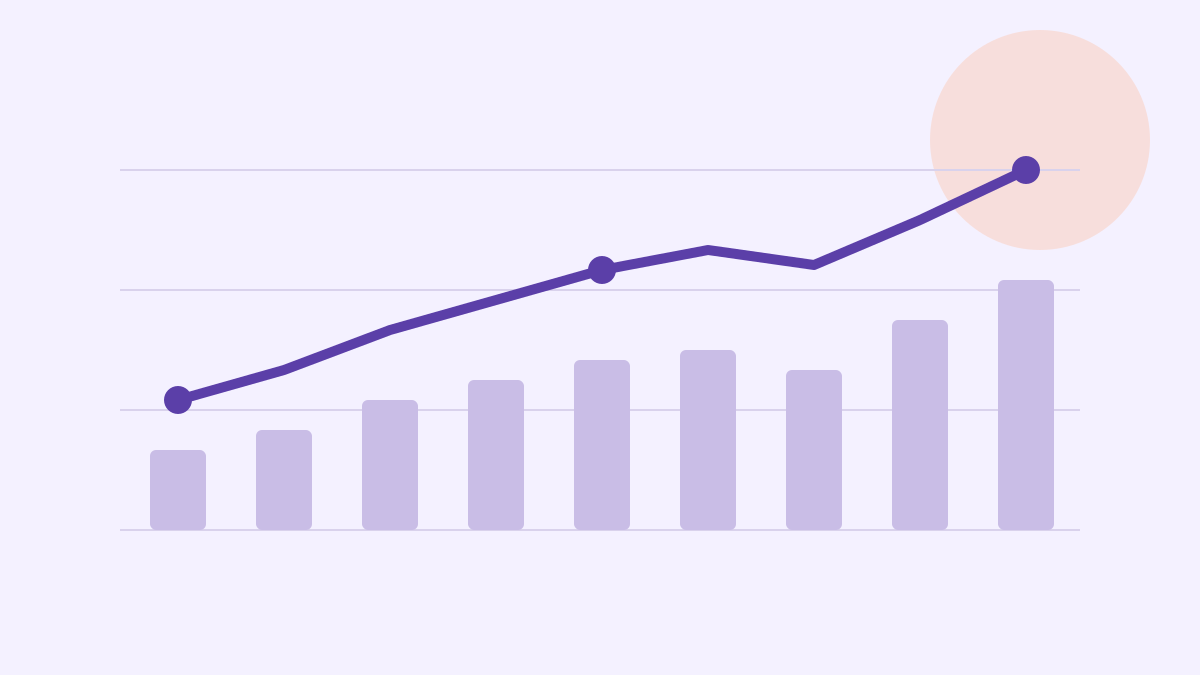
Every month we send each client the same three charts about their search traffic. They answer the questions owners ask most: is the blog growing, which pages bring readers in, and how much of it now comes from AI search. This post shows the three charts for a typical client in 2026 and how to read them.
The numbers below are from one anonymised client, a software company with a blog of about two hundred posts, and come from its own Search Console and analytics, read on 31 October 2026.
Search traffic month by month #
The first chart is the one owners look at first: visits from search engines each month, split into Google and every other engine. The numbers sit in a CSV file next to this post, so we update the file and the chart redraws itself when the site is built.
| Month | Other engines | |
|---|---|---|
| Jan | 18.2k | 2.1k |
| Feb | 19.0k | 2.2k |
| Mar | 21.4k | 2.4k |
| Apr | 22.9k | 2.6k |
| May | 24.1k | 2.8k |
| Jun | 25.3k | 2.9k |
| Jul | 24.6k | 2.9k |
| Aug | 22.8k | 2.7k |
| Sep | 26.9k | 3.1k |
| Oct | 29.4k | 3.4k |
Search traffic grew steadily after a slow start. The dip in August is the summer, not a problem: it happens in the same weeks every year. Read a chart like this one against the same months last year, never against last month alone.
Which pages bring readers in #
The second chart lists the pages that brought the most visits from search in October 2026. Long guides and comparisons lead, and the home page is not even in the top five.
If most of your search traffic lands on a few guides, give them the most care: update them first, link to them from new posts and keep their titles sharp. Our playbook for posts that slipped shows how.
How much comes from AI search #
The third chart is new this year. It shows the share of visits that came from AI search tools, such as answers that cite the blog, in each quarter of 2026 beside the same quarter of 2025. To earn more of those visits, read our guide to writing for AI search.
| Quarter | 2025 | 2026 |
|---|---|---|
| Q1 | 0.6% | 2.1% |
| Q2 | 0.9% | 3.4% |
| Q3 | 1.4% | 4.8% |
| Q4 | 2.0% | 6.5% |
The share of search traffic from AI tools is still small, but it tripled in a year. Pages that state a fact plainly and show its source get quoted most, as our post on how AI search picks which pages to quote explains.
Where our clients are #
Most of the blogs in this report belong to companies near our Bristol office. The map is a live one: drag it, zoom in and out, it works right here in the post.
Build these charts for your own blog #
You do not need a dashboard tool to chart your search traffic. Export the months from your analytics as a CSV file, put it next to the post and name it in the chart. Our own planning tool, Larkspur Planner, makes the same three charts from your Search Console data and keeps the file up to date for you.
By Priya Raman. Published .
About the author

Research editor at Larkspur Studio
Experience MSc in Statistics, runs the yearly Larkspur content benchmark
Priya turns questions about content into numbers you can trust. She designs the yearly Larkspur content benchmark, checks every statistic we publish against its source, and writes about measuring what content earns and how AI search chooses what to quote.
Reviewed by