
Video notes: debugging INP with field data
Our notes on debugging INP on a blog. Read the field data, split a slow tap into its three phases, and find the cause in Chrome DevTools.

Debugging INP starts with field data, not with a lab test. Field data tells you which pages feel slow to real readers and on which devices. Then you reproduce one slow tap in Chrome DevTools, split it into its three phases, and fix the phase that takes longest. These are our notes, next to a talk from the Chrome team.
What INP measures #
Interaction to Next Paint, or INP, measures how quickly a page responds when someone clicks, taps or types. The browser times each of those interactions during a visit, from the input to the next frame painted on screen. The page's score is close to the slowest one. web.dev's guide to INP sets the bands: 200 milliseconds or less is good, and over 500 milliseconds is poor.
On a blog, the slow interactions are rarely in the article. They hide in the menu button, the search box, the cookie banner and the comment form. Our Core Web Vitals guide for writers covers the other two metrics.
Read the field data first #
Field data comes from real visits. Lab data comes from one test on one machine. For debugging INP you need both, but in that order, because a lab test only shows what you thought to click.
- The Chrome UX Report (CrUX). Google's public set of real Chrome user data. Its documentation explains what it covers. PageSpeed Insights shows it at the top of each report, for the page and for the whole site.
- Search Console's Core Web Vitals report. It groups your URLs into good, needs improvement and poor, and names the metric at fault. Google's page on Core Web Vitals and search links to it.
- Your own field data. The web-vitals library can send each visit's INP to your analytics, with details on the element that was tapped.
Look for a pattern before you open DevTools. Is it every template, or only pages with comments? Phones only, or desktop too? A group of slow URLs that share one template usually share one cause.
The three phases of an interaction #
Every interaction has three parts. Your fix depends on which one is long.
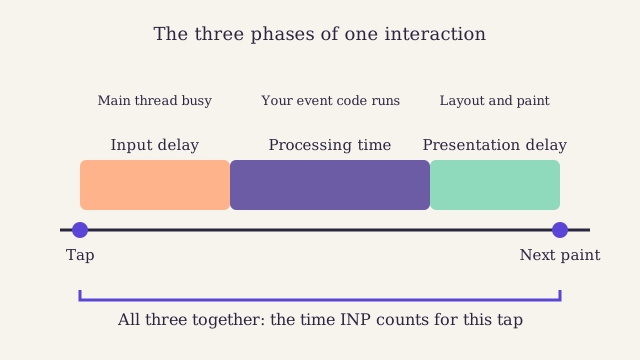
One tap, from finger to frame. Look for the longest of the three bars: it tells you where to start.
- Input delay. The time before the page can even start to respond. It is long when the main thread is busy with other work, such as a script still loading.
- Processing time. The time the page's own code takes to handle the event. It is long when a click handler does too much at once.
- Presentation delay. The time the browser needs to work out the layout and paint the next frame. It is long when the page is huge or a change forces the whole layout to be worked out again.
Common causes on blogs #
| Cause | Phase it hurts | What to try |
|---|---|---|
| Heavy third-party scripts: ads, chat widgets, tag managers | Input delay | Load them later, or drop the ones nobody uses |
| A large DOM: long comment threads, mega menus | Presentation delay | Paginate comments, simplify the menu |
| Long tasks from theme scripts | Input delay and processing time | Split work into smaller pieces, defer what can wait |
| A search box that filters on every key press | Processing time | Wait until the reader pauses before filtering |
The DOM is the tree of elements the browser builds from your HTML. Every element in it adds work when the layout changes.
Find a slow interaction with Chrome DevTools #
-
Pick the page and the element
Use the field data to choose a slow page. Guess the likely element: menu, search, banner or form.
-
Slow the CPU down
Open DevTools, go to the Performance panel and turn on CPU throttling. Your laptop is faster than most readers' phones.
-
Record the interaction
Start a recording, click the element once, then stop.
-
Read the Interactions track
Find your click in the Interactions track. Hover over it to see the three phases and which one is longest.
-
Look at the main thread
Under the interaction, find the long tasks. DevTools marks them with a red corner. Open one to see which script ran.
-
Fix, record again, then wait
Make one change and record again. Then watch the field data, which takes weeks to catch up.
Keep it fixed #
Most INP regressions on blogs arrive with a new widget, not with new writing. Add a check for new third-party scripts to your technical SEO audit, and test the menu and search on a phone after every theme update. Good speed also supports the structured data on your pages and content work you have already done, because a page that responds fast keeps the reader you earned.
Signing up by email is not open on this site.
About the author

Technical SEO lead at Larkspur Studio
Experience Nine years in technical SEO, former web performance engineer
Tomas looks after everything a crawler sees before a reader does: page speed, structured data, sitemaps and redirects. He spent four years making a large online shop load faster before he moved to search. He writes in English and German.
Reviewed by